
Reading time: 7 minutes
This article is about the evaluation of usage statistics. It ties in with the article Advantages of a Well-Promoted Apps. As an example, we have chosen the sponsors. We think you can get even more out of your sponsors with measurable numbers showing the sponsors’ reach.
We will show you how to evaluate the usage statistics of the corresponding subpages. Just use this guide and try it out. The results are really very interesting!
Google Analytics – the integration
In your Plus and Premium package, we have already prepared an integration with Google Analytics for you. All you have to do is connect your account to LineUpr. Instructions can be found here: https://lineupr.com/en/blog/how-to-analyze-event-statistics
Analysis using the sponsors as an example
We would like to explain the analysis of the usage data to you by, for example, visits to your sponsors’ profiles. But before we start, here is an explanation of the benefits that this will bring you.
Many offers towards the sponsors are still based on publishing a logo on printed materials such as flyers and posters. In the days of digital promotion, this is, for many reasons, no longer a good deal: Firstly, the conversion from paper to a digital media like a smartphone is relatively poor if the added value is not given. This means that only very few participants will continue to deal with the sponsor at all. Secondly, paper is pretty unwise when it comes to analyzing usage statistics.
No one knows how many times the logo was viewed on a poster. With LineUpr and Google Analytics, this is no longer a problem!
Now just imagine how happy your sponsors would be if you could give them a document which shows them exactly how many people viewed the sponsor’s profile and how often. If you then negotiate a bit more, not only will you have the deal for next year in your pocket, but you can certainly get more out of it.
The Concrete Steps – Analysis of the Data
Now we can go into the analysis of the data. The sponsors’ profiles are always hidden in the same place of the app. The link there, however, varies every time. This is composed of your organizer’s name and the event name. In addition, each sponsor has its own link. An example link looks like this: https://www.lineupr.com/[Organiser]/[Event]/[sponsors]/[name of the sponsor]
Here is the explanation of the link:
- Organiser: The name of your LineUpr account.
- Event: The name of your event.
- Sponsors: By default, this is called “sponsors”. If you changed the wording in the settings (for example to partner), your choice will appear here.
- Name of Sponsor: Here the name of the sponsor is displayed.
Of course, you can present sponsors in different places in the app, for example under locations. More tips about this can be found in this article: https://blog.lineupr.com/en/sponsoring-event-app/
Of course, this works similarly for other pages in the app.
Tip: If you do not know the link to the page that you want to find in Google Analytics, just open the page in the CMS (for example, a specific point in the program) and look at the address bar. The line after the last slash (“/”) is your search term. If the search does not produce any results, that corresponds to a number of 0 views.
Filter Google Analytics
Now that you know what to look for, you can ask Google Analytics for it. This works best by following these steps:
- On the left sidebar go to “Behaviour” (1) and then to “Overview” (2)
- Now go below the table on the right to “show full report” (3)
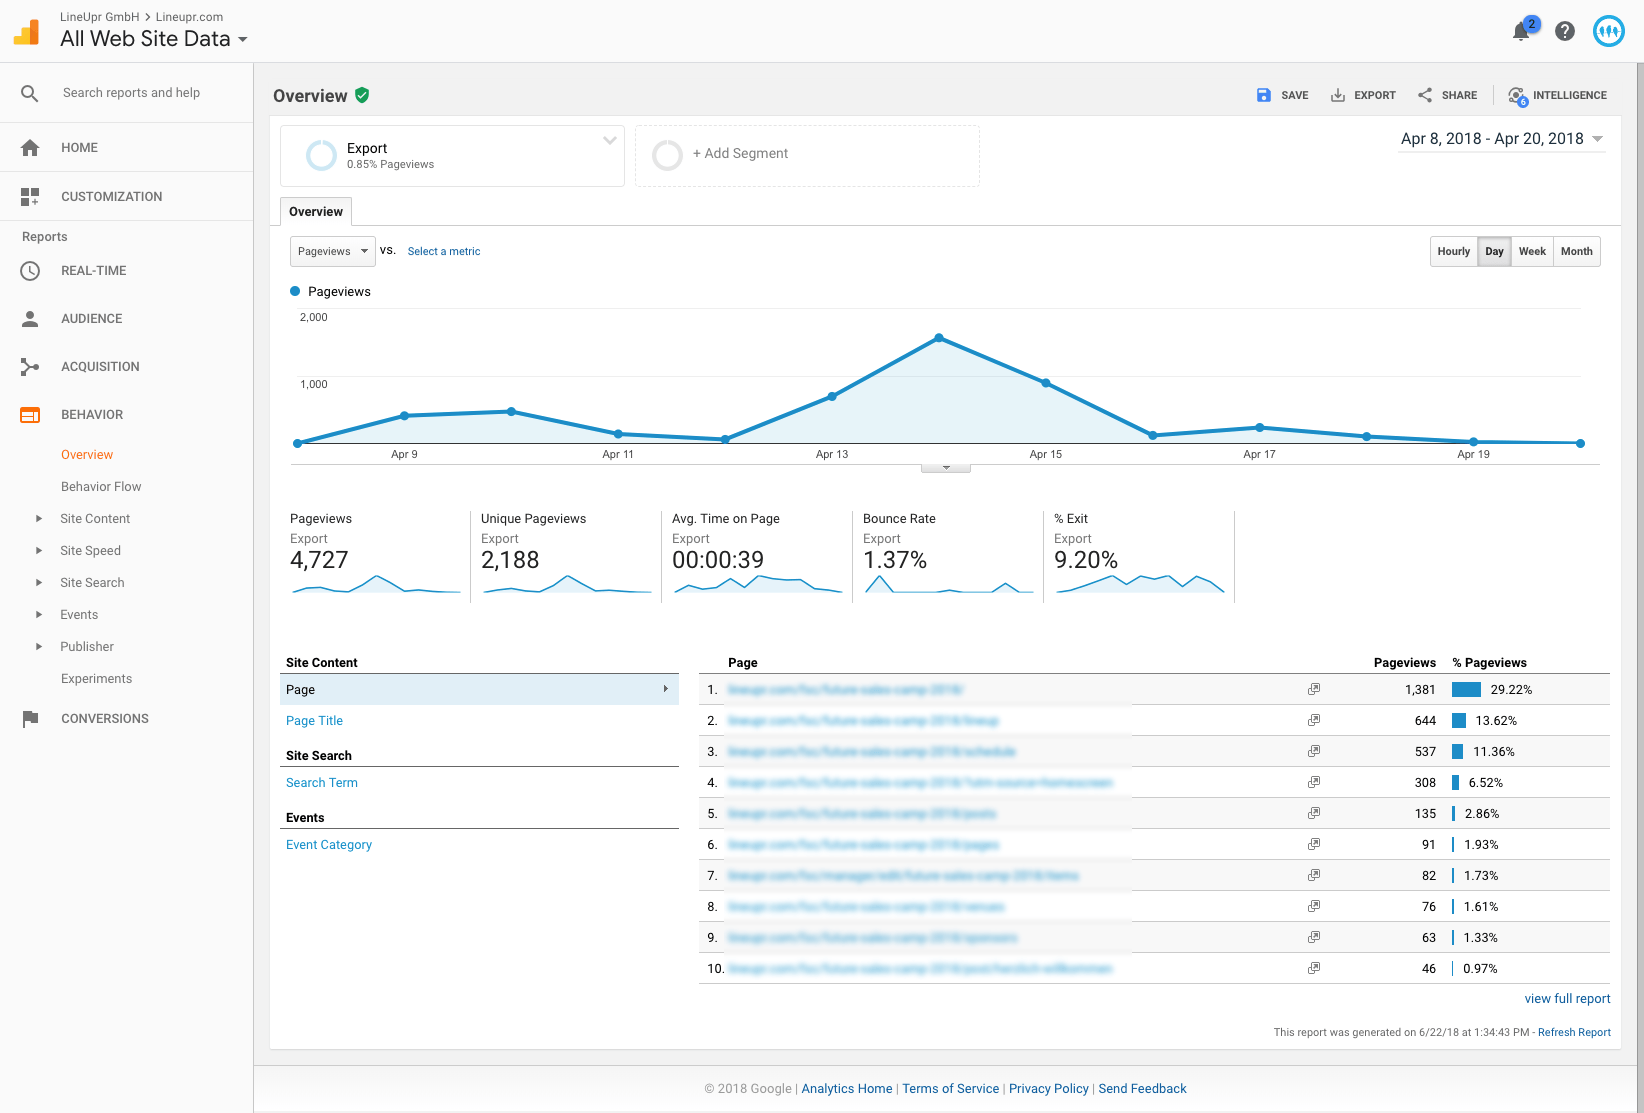
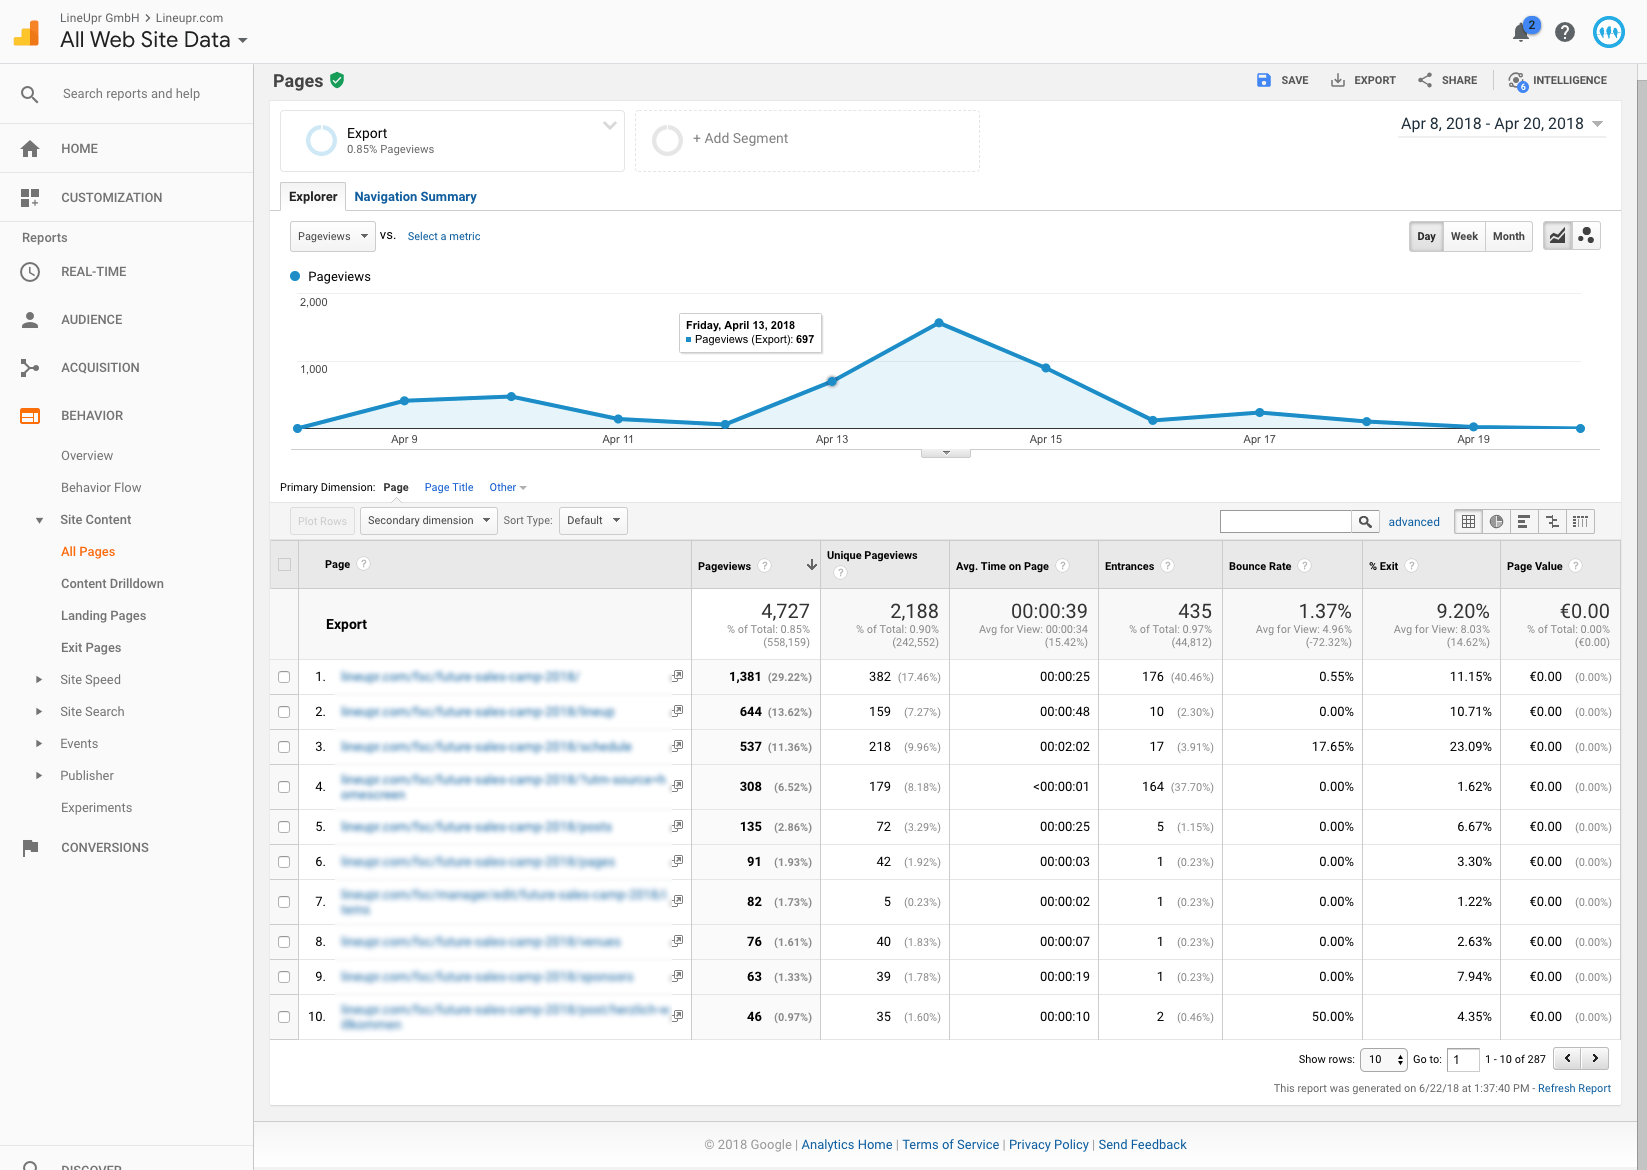
Now you can see an overview of all subpages. In the search bar (4) you can now look for different keywords. Just enter it and click on the small magnifying glass (5).
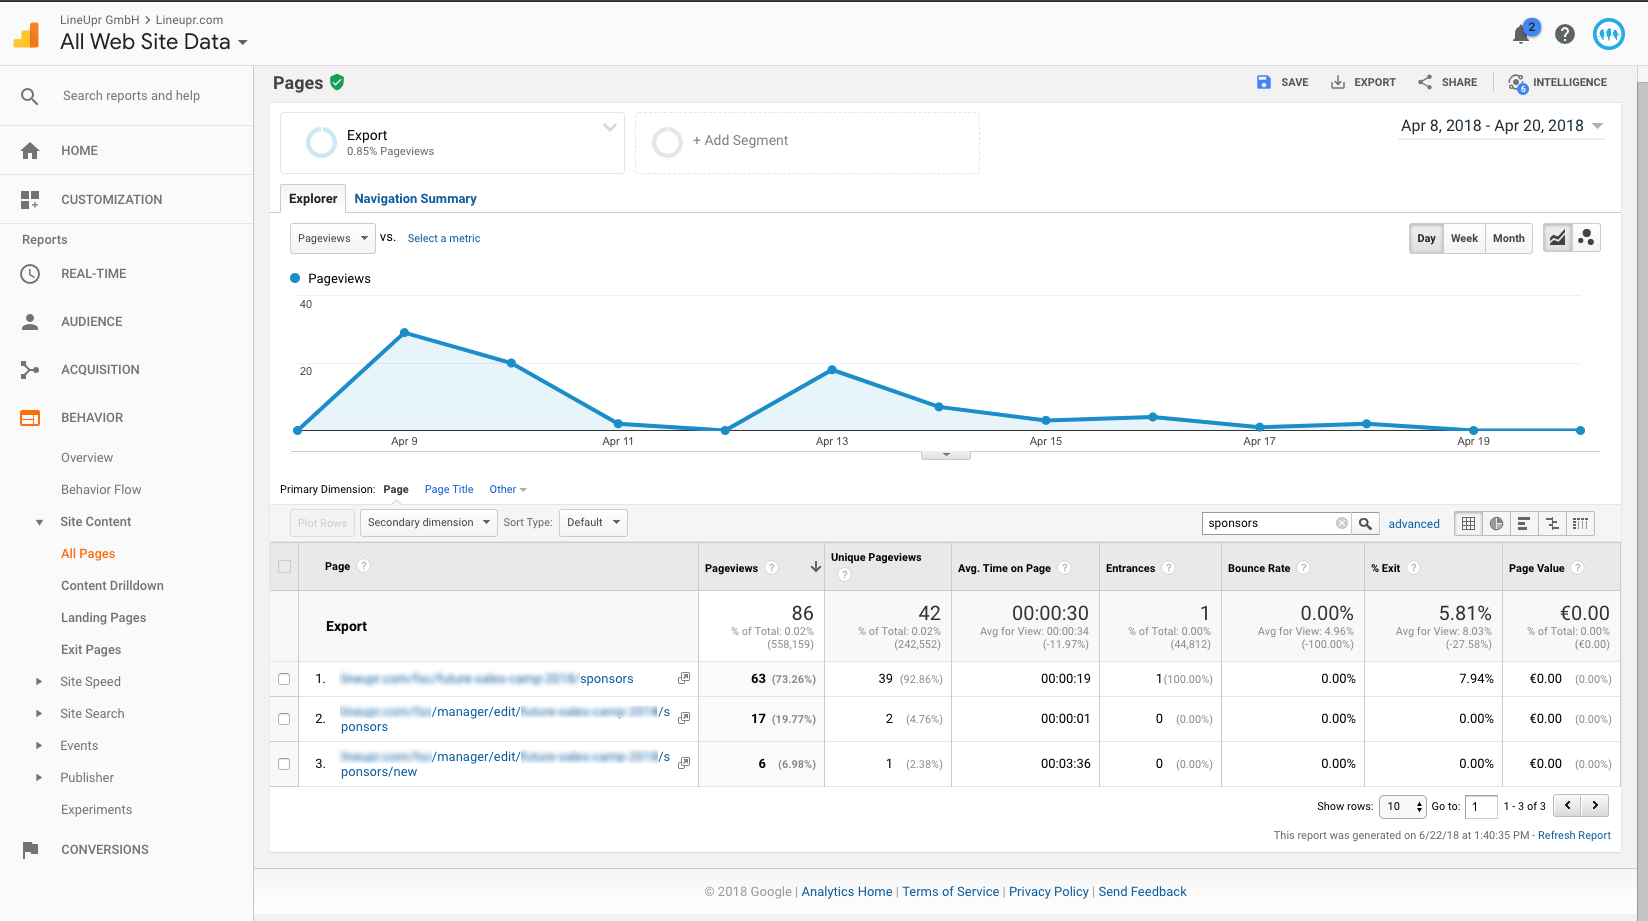
In the picture below, you can see all the pages of the app that match your search term. The entries are sorted by the frequency of the views. In our case, we have blurred the links for privacy reasons. The first entry is the one for the sponsor’s overview and contains all the views on the subpages, i.e. the sponsors’ profiles. The second entry refers to the page where you can edit the sponsors in the CMS. Therefore, it has nothing to do with the actual use of the app.
The Evaluation
Now you know how to get the data that you can share with your sponsors. The view generated can also be saved and shared. Simply click on “Export” (6 in the picture above) and select PDF as the file format. You can repeat the search and export process for each of your sponsors.
What should you have learned?
We’ve shown you how to use Google Analytics to track your visitors’ traffic on your sponsors’ profiles in the LineUpr app. With this step-by-step guide, there should not be any more problems. If so, just contact us – we are happy to help!
How do you design the reports for your sponsors? Are there any things we have forgotten? We always welcome feedback in the comments!
“analytics” Icon created by Gregor Cresnar from “the Noun Project“.